Showing posts with label PowerBI. Show all posts

Monday, August 15, 2022

Automating Teams voice reporting of users (2:2)

This is a follow up on my last blog post covering automated teams voice assignment for users. This time I will cover how the mentioned routine has been expanded to do reporting in PowerBI to show evolution and distribution throughout the lifetime of the service.

After running my routine of automated voice assignment in Teams for a while, I felt the need to have an overview of the solution and how it evolved.


Tuesday, April 19, 2022

Veeam Backup for M365 Automatic Reporting in PowerBI

Those of you which has read through the Microsoft services agreement might have noticed paragraph 6b where Microsoft recommends that you regularly backup your content and data that you store on the services using third-party apps and services. One example of such third party tool popular by managed service providers is the Veeam Backup for Microsoft 365. This blog post will explain how you can get automatic reporting on licenses and sizes used by this application.

Please note: This is not a sponsored post!

Data Deletion

Data deletion can occur when an attacker deletes your data, usually in a way that makes recovery difficult, if not impossible. A variant of this type of attack includes ransomware. With ransomware, an attacker compromises the network, encrypts data, and then demands a payment to get the key to decrypt the data. This may equate to data deletion since a successful extraction of payment often leads to more targeting by the attacker. Attacker motivations for data deletion covering the tracks of an attack, attempting to do irreparable harm to your business, or simply trying to spite you or your employees

Preventing data deletion

Other than the protection mechanisms you should employ to prevent account breach an elevation of privileges, your core prevention strategy should be to ensure you have sufficient redundancies built into your data management processes to minimize the impact of data deletion. Data in Microsoft 365 is made redundant for maximum availability by the service. However, it's still possible for an attacker to delete data from SharePoint sites and recycle bins, making it almost impossible to recover. There is also examples of bugs where data has been deleted from Teams and Sharepoint. Therefore, it's critical that you have a process for backing up mission critical data to offline stores - just like the Microsoft Services Agreement states.

Veeam Backup for Microsoft Office 365

Veeam Backup for Microsoft 365 is one application which can help eliminate the risk of losing access and control over your Office 365 data, including Exchange Online, SharePoint Online, OneDrive for Business and Microsoft Teams. This product is often used by managed service providers offering their services to customers. One challenge will be to automate a reporting solution showing the usage of the service related to license and storage on repositories.

Report automation

Niels Engelen has described a way to automatically send reports from Veeam by email. This is a simple approach to the standard functionality where PDF report will be sent by e-mail. It just didn't fit my expectations for reporting. 

PowerShell data harvesting

I have studied the Veeam Backup for Microsoft 365 PowerShell Reference and made a script counting all licenses, data usage and repository usage on a daily basis. This data is prepared in a JSON format and uploaded to an Azure Cosmos Database. The Azure Cosmos Database is quite inexpensive for this kind of usage. 

The following query will list all licensed users in a JSON format before uploading each record to the Cosmos database.
# Get VBO Licensed users, convert to JSON and upload to CosmosDB
$CosmosDBCollectionID = 'VeeamBackupLicenses'
$LicensedUser = Get-VBOLicensedUser

$output = foreach ($user in $LicensedUser) {
    $LastBackupDate = (($user.LastBackupDate).toString()).Split(" ")[0]
    $id = $([Guid]::NewGuid().ToString())
    $doc = [pscustomobject]@{
        id               = $id
        Username         = $user.UserName
        LastBackupDate   = $LastBackupDate
        Year             = (($LastBackupDate).toString()).Split(".")[2]
        Month            = (($LastBackupDate).toString()).Split(".")[1]
        LicenseState     = $user.LicenseState
        OrganizationName = $user.OrganizationName
    }
    $document = $doc | ConvertTo-json | Out-String
    # Writing data to CosmosDB
    New-CosmosDbDocument -Context $cosmosDbContext -CollectionId $CosmosDBCollectionID -DocumentBody $document -PartitionKey $id -Encoding UTF-8
}


The next query will get the usage pr. organization and upload this to a CosmosDB in JSON format:
# Get VBO Usage pr Organization, convert to JSON and upload to CosmosDB
$CosmosDBCollectionID = 'VeeamBackupUsage'
$Organizations = Get-VBOOrganization
$Date = get-date -Format "dd.MM.yyyy"

$UsageOutput = foreach ($Org in $Organizations) {
    $UsageData = Get-VBOUsageData -Organization $Org
    # Need to handle the fact that a customer can have data in several repositories
    foreach ($Usage in $UsageData) {
        $id = $([Guid]::NewGuid().ToString())
        $UsedSpaceGb = [MATH]::Round((($Usage.UsedSpace) / 1024 / 1024 / 1024), 1)
        $Udoc = [pscustomobject]@{
            id               = $id
            Date             = $Date
            RepositoryId     = $Usage.RepositoryId
            UsedSpaceB       = $Usage.UsedSpace
            UsedSpaceGB      = $UsedSpaceGb
            OrganizationName = $Usage.Organization.DisplayName
            OrganizationMSID = ($Usage.Organization.Id.Value).Split(":")[0]
        }
        $Udocument = $Udoc | ConvertTo-json | Out-String
        # Writing data to CosmosDB
        New-CosmosDbDocument -Context $cosmosDbContext -CollectionId $CosmosDBCollectionID -DocumentBody $Udocument -PartitionKey $id -Encoding UTF-8
    }
}

The third query will get information about the repositories defined in Veeam Backup for Microsoft 365 and upload this in JSON format to the Cosmos Database. The original data values from the queries are in bytes format.
# Get VBO Repositories, convert to JSON and upload to CosmosDB
$CosmosDBCollectionID = 'VeeamBackupRepositories'
$Repositories = Get-VBORepository
$Date = get-date -Format "dd.MM.yyyy"

$RepositoryOutput = foreach ($Repo in $Repositories) {
    $id = $([Guid]::NewGuid().ToString())
    $RepoCapacityTb = [MATH]::Round((($Repo.Capacity) / 1024 / 1024 / 1024 / 1024), 1)
    $RepoFreeSpaceTb = [MATH]::Round((($Repo.FreeSpace) / 1024 / 1024 / 1024 / 1024), 1)
    $Rdoc = [pscustomobject]@{
        id                    = $id
        Date                  = $Date
        RepositoryId          = $Repo.Id.Guid
        RepoName              = $Repo.Name
        RepoPath              = $Repo.Path
        RepoCapacityB         = $Repo.Capacity
        RepoCapacityTB        = $RepoCapacityTb
        RepoFreeSpaceB        = $Repo.FreeSpace
        RepoFreeSpaceTB       = $RepoFreeSpaceTb
        RepoRetentionType     = $Repo.RetentionType
        RepoRetentionPeriod   = $Repo.RetentionPeriod
        RepoRetentionFreqType = $Repo.RetentionFrequencyType
    }
    $Rdocument = $Rdoc | ConvertTo-json | Out-String
    # Writing data to CosmosDB
    New-CosmosDbDocument -Context $cosmosDbContext -CollectionId $CosmosDBCollectionID -DocumentBody $Rdocument -PartitionKey $id -Encoding UTF-8
}

These different Powershell parts are coordinated and scheduled to run as powershell scripts on a regular basis on the Veeam backup servers.
  <Actions Context="Author">
    <Exec>
      <Command>C:\Windows\System32\WindowsPowerShell\v1.0\powershell.exe</Command>
      <Arguments>-ExecutionPolicy bypass -file "C:\Simon\CountVeeam365LicensesDailyToPowerBI.ps1"</Arguments>
    </Exec>
  </Actions>

PowerBI data analyzis

Using PowerBI Desktop, it is easy to connect to the Cosmos Database. With the data loaded into Microsoft PowerBI you can do further manipulations of the data using DAX queries. One example could be to calculate the difference between capacity and free space for the repositories in order to get the used space pr. repository. This could be done like this which will return a separate column with the result ready to use in the report:
RepoUsedSpaceB = CALCULATE(SUM(VeeamRepositories[RepoCapacityB]))-CALCULATE(SUM(VeeamRepositories[RepoFreeSpaceB]))

I have also made a calculation of consumed GB pr user in each company. This is done in two steps. First I calculate number of users pr. company:
AntallBrukere = DISTINCTCOUNT(VeeamLisenser[Bruker])

Then I calculate consumed GB pr user in the company:
GBprBruker = SUM(VeeamUsage[UsedSpaceGB])/Kalkulasjonstabell[AntallBrukere]

Using Power BI we can easily create several reports to visualize the status of the service.

Example of monthly report of all companies and users protected by Veeam 365 Backup which can be the basis for invoicing where this is based on the number of users in the system pr. company.


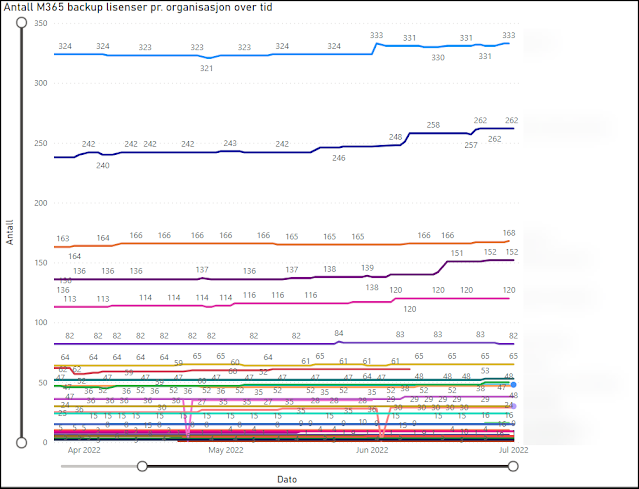
Example of historical development of backup up users pr. company by Veeam 365 backup.

Example of gigabyte compared to number of users pr. company protected by Veeam 365 backup.

Example of usage of the calculated column for GB pr User. Infinity comes from stored data for customers which have terminated their contract where data still exists. This has been removed from the graph with a visuals filter displaying only companies with more than 0 users.


Example of report for repositories with forecast in the Veeam 365 backup service.

This gives a fully automated always up to date reporting solution showing current usage and historical development related to the provided service, license usage and storage consumptions. The reports can easily be filtered by clicking on the values and graphs giving the consumer of the reports the ability to select the desired view. 


The animation is blured to protect the data exposed in the report

If you upload your PowerBI report to the online PowerBI service, you can set the dataset to automatically update directly from the Cosmos Database. This will allow for online consumption of the report from all your devices. One idea could be to add it as a tab in a suitable team channel in Microsoft Teams giving easy access for everyone interested in the topic.

I do believe someone could have interest in the PowerBI Report file, but unfortunately this can't be shared because my reports contains PII data. 

Conclusion

I hope this could inspire someone to dive into data capturing and report building. If you have thoughts, ideas, comments or ideas after reading this far, please add a comment.


Sunday, April 3, 2022

Good insights in Microsoft license usage

Cloud based IT solutions does have a pretty predictive cost when each and every license is based on a price pr user pr month. This should make it easy to budget the cost of each user role. The challenge might be to have an up to date overview of the license portfolio, both current and over time.

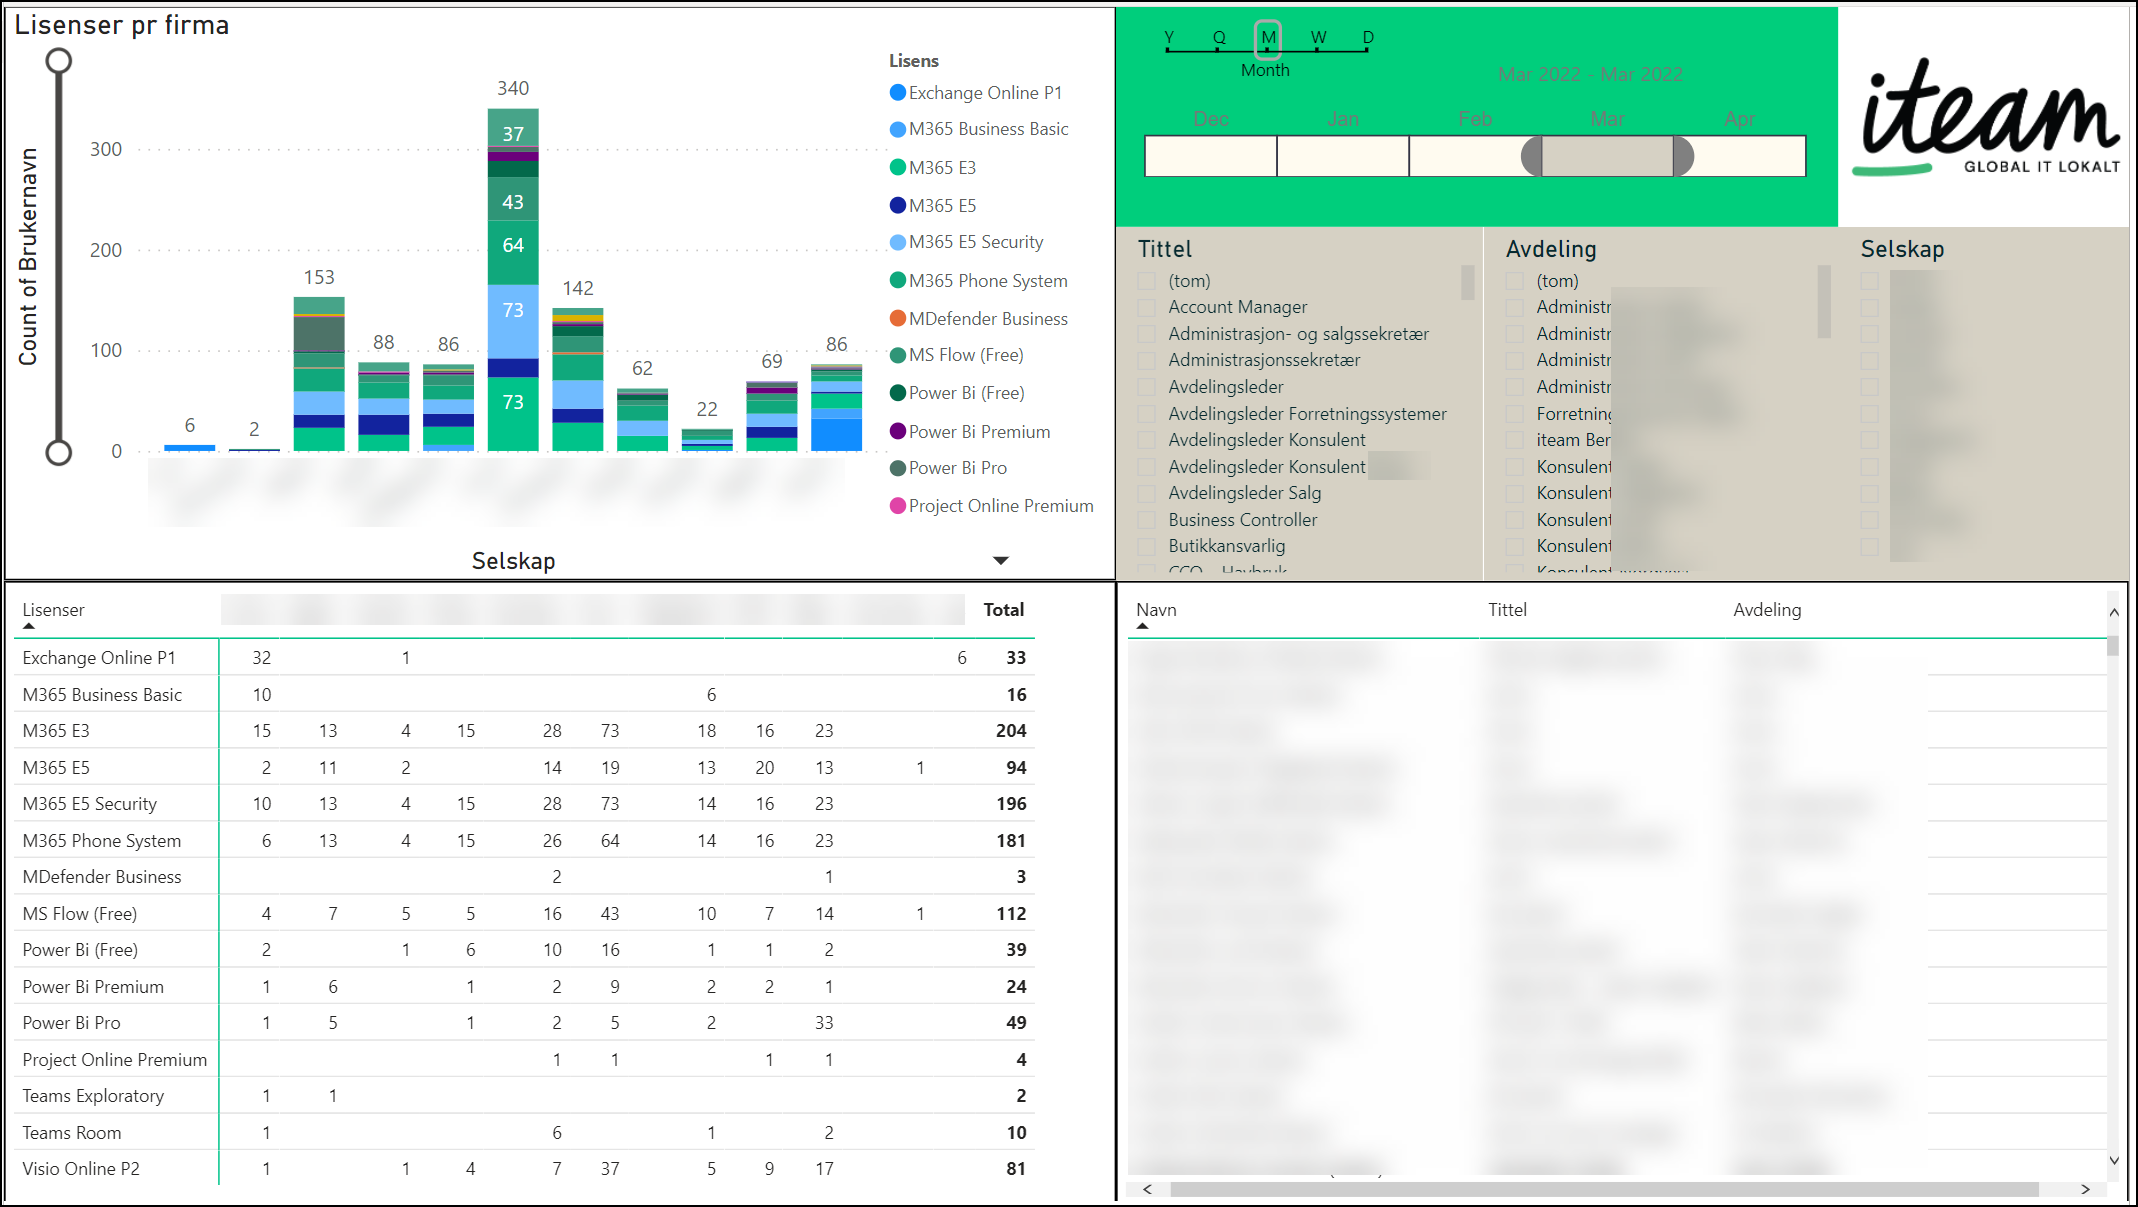
In order to give automated insights to the license situation, I have made a solution which has been installed at several tenants. Based on Microsoft Graph API powershell queries for running in Azure function apps, I am populating license information data from user accounts to a cheap Azure Cosmos DB. These data are then connected to PowerBI where I have created a report giving a detailed insight to the license portfolio pr. company, department, user. The report which can be granulated on year. quarter, month, week or day gives an accurate insight to the consumption of Microsoft licenses in the tenant, which helps address any misconfigurations.

The report has several pages, where the first page gives an overview over license consumption based on company/department with both a graphical and detailed table overview as well as personal details. The report can easily be filtered by clicking on the values in each part of the report.

Click for a larger version

Page two of the report has got a timeline showing the development of Microsoft licenses over time. The report can be filtered by company/department, license or user. This gives an insight to license usage which can't be found elsewhere. The picture below is an example where you clearly can spot a change in SKUs on a large amount of users over time. 

Click for a larger version

In some cases there has been developed even further report pages in order to address the need of insights to the usage of Microsoft licenses, and these reports have several times been used to detect misallocated licenses which in turn have resulted in significant cost savings over time. An example of such report could be the one including groups used to assign licenses to the user accounts.

Click for a larger version

Regarding costs for running the function and cosmosdb in Azure, they seems to be reasonably low. A typically SMB company with arround 200 users shows cost arround 5 NOKs for one month. 

Please let me know if you find this kind of technological usage interesting.

Friday, March 9, 2018

PowerBI MAP og plassering av byer på riktig sted

PowerBI er et utrolig kraftig verktøy for å sammenstille og vise data på nye og spennende måter. Herunder finnes også flere muligheter for å plotte grafikk i kart. Utfordringen her er ofte å få riktige byer på riktig sted i riktig land. Her kommer noen erfaringer på hvordan dette løses.

En forutsetning for å kunne plassere datamengder i kart, er at riktig data kategori blir valgt:
Velg geografiske data kategorier for felter med elementer av adresse i seg.

Når dette er gjennomført, ser du at det kommer en klode foran hvert felt:
Globen markerer at dette er kategorisert som adresse
Disse dataene kan nå benyttes i PowerBI visualiseringer som f.eks. MAP.

Jeg har opplevd problemer med at byer blir plassert i feil land. Et raskt søk på nettet viser at dette er et ganske vanlig problem. Dette kan løses med å lage et felt som spesifiserer land i tillegg til by med datakategorien "Place":
Poststed og land kombineres til et lokasjonsfelt med datakategorien Sted.

Disse stegene har stort sett fått poststed plassert på riktig sted, men vi har likevel opplevd å få feilplasseringer. Her er et eksempel hvor Kristiansund er plassert helt feil:
Eksempel hvor Kristiansund er plassert på feil sted i kartet.

PowerBI sin MAP virtualisering benytter BING Maps. Et søk etter "Kristiansund, Norway" i Bing Maps viser riktig posisjon i kartet:
Manuelt søk etter by i Bing gir riktig plassering

Ved nærmere ettersyn ser vi at PowerBI har navnet "Kristiansund N", og ikke bare "Kristiansund" på poststed. Gjør et søk i Bing Maps på "Kristiansund N, Norway" og ser da at jeg får feil plassering. Dette tyder på at ukjente steder for Bing blir plassert midt i landet de ikke kjenner igjen lokasjonsnavnet:
Søk etter "Kristiansund N" gir feil plassering.

For å få dette riktig må vi gjøre en liten tilpassing av dataverdiene i PowerBI. Dette gjøres med en en søk-erstatt rutine hvor " N" erstattes med "" (ingenting).
Erstatter her " N" med ingenting i datafeltet Poststed.

Etter det får jeg riktig plassering av Kristiansund og et par andre lokasjoner som hadde fått med " N" på slutten av navnet:
Alle bynavn har nå riktig plassering i PowerBI MAP
Alle fremtidige oppdateringer av datagrunnlaget går nå gjennom den samme logikken og tilpassingen i PowerBI og vil slik gi riktig visning. Dette eksempelet var fra en rapport som viste talestatistikk fra Trio Enterprise med geografiske posisjoneringer fra nummeroppslag mot Eniro. Ved å sammenstille data fra ulike kilder får man enormt spennende datagrunnlag å jobbe med i PowerBI. Man må kjenne til datagrunnlaget sitt og eventuelt gjøre enkle tilpasninger slik som demonstrert over her. Når det først er gjort har man i PowerBI et kraftig verktøy for å gi nye og unike innsikter i tallmaterialet!

Friday, January 6, 2017

Trio Enterprise statistikk via Microsoft Power BI

Trio Enterprise har veldig mye statistikk og data tilgjengelig - kunsten blir etter hvert å kunne gjøre en automatisert fremstilling med ønskede tall. Her kan Microsoft PowerBI vise seg å være et godt verktøy!

De som kjenner Trio Enterprise vet at det finnes mange muligheter for å hente ut statistikk. Man finner tall på det meste i de mange rapporteringsalternativene som er tilgjengelig. Problemet i hverdagen er ofte at man må hente tall på forskjellige steder for å få frem de måltall man er på jakt etter. Dette kan være både tidkrevende og uoversiktlig og man kommer ofte i den situasjon at man ønsker en automatisert datauthenting og presentasjon av akkurat de tallene man ønsker. Her kan Microsoft PowerBI være et nyttig verktøy.

Microsoft PowerBI er et kraftig verktøy for å visualisere og sammenstille data for å kunne fokusere på de data man ønsker. Om man har kjennskap og eierskap til datagrunnlaget er dette et meget anvendelig system for å lage gode og spennende visualiseringer. Man kan også med enkelhet kunne ta med Power BI dataene ut til webtjenester og mobilklienter for å gi enkel tilgang til tallmaterialet.

Følgende video viser et lite eksempel på Power BI koblet opp mot Trio statistikken.


Microsoft PowerBI er også sterk på sammenstilling av data fra ulike kilder. I forhold til Trio så kunne det for eksempel vært interessant å sette samtalestatistikken opp mot salgstall for organisasjoner som driver med telefonsalg. Da har man straks andre måltall for å styre callsenterløsningen sin!

Bare for kuriositetens skyld har jeg her satt opp en tabell som viser antall samtaler i 2016 sammenstilt med gjennomsnittstemperaturen hentet fra målestasjonen på nærmeste flyplass. Ikke så store tallmengder i dette callsenteret, men vi ser kanskje en tendens til færre samtaler inn når det er varmt i luften.

Antall samtaler sammenstilt med temperatur

Her er et eksempel på statistikk basert på den geografiske informasjonen vi får inn gjennom Eniro integrasjonen i Trio. Denne gir som kjent riktig navn på innringer, men integrasjonen har også med seg fullverdig adresse på innringer. Dersom man tar vare på denne kan man her i PowerBI kunne lage seg rapporteringsverktøy som lister de stedene som genererer mest samtaler, hvilke tjenester disse stedene ringer inn til, hvilke køtider og samtaletider man har, når på døgnet de ringer fra de geografiske lokasjonene osv.
Enkelt eksempel på bruk adresseinformasjon sammen med samtaleinformasjon
Det er snart et år siden jeg startet å eksperimentere med Trio sine tall i PowerBI. Når jeg nå gjorde ferdig dette blog innlegget kom jeg frem til at det i bildet over også hadde vært interessant å ha med en graf for ukedager, samt en ny timeslicer. Disse ble raskt satt inn og da hadde jeg grafisk fremstilling også av dette i. Følgende bilde viser samtalene så langt i år (06.01.2017) hvor samtalene fra Kristiansund er markert. Ser da raskt at hovedtyngden av samtaler fra Kristiansund kommer tidlig på mandager. Slike trender kan da være med å styre hvor vi plasserer vårt personell på mandags morgener.
Nytt eksempel på adresseinformasjon sammen med ny timeslicer og graf for ukedager. Dette er fra webklienten.

Trio har kommet med mye ny funksjonalitet i sine statistikker de siste årene med mulighet for automatisk generering og utsending av favorittrapporter med mere. Jeg tror likevel etter å ha lekt med Trio tall i PowerBI at dette vil være utrolig spennende og givende for de som har virkelig interesse i å snu og vende på datamengdene for å få bedre innsikt i kundesenteret sitt. Når man i tillegg kan koble dette sammen med andre relevante datakilder har man et meget godt utgangspunkt til å styre sin business!